Population Ecology
Sheesh! I need to take a break! One hour of straight typing is hell for my hands.
This section deals with the ecology of populations - groups of individuals of the same species. By the way, did I ever mention I'm listening to Bobby Prince's Deep in the Code?
Populations A population is a grouping of individuals of the same species that rely on the same resources, and are influenced by the same environmental factors. |
The easiest concepts of Population are actual measurement of population numbers:
Density + Dispersion
They both might seem like the same terms, and they almost are.
Density measures how widely or closely a population is distributed
among an area.
Dispersion measures the pattern the population
is distributed over an area.
Patterns of Dispersion:
Clumped
Random
Uniform
Grain The concept of grain deals with how individuals view their environment. Probably the only good way of explaning it is through example. I like the book's example, so I'll use it here: for a horse in a field, all of the plants seem the same. It's just one big field to the horse. This is called fine grained environment. However, to a small bug, this same field is a coarse grain environment - every single flower is like a different planet to it. |
Demography
Like learning is to behavioral biology, demography plays a huge part in the study of population ecology. What is demography, exactly?
Demography is the study of the vital statistics (statistics that have to do with age structure, life, sex ratios, etc.) of a population.
The terms birthrate (or fecundality), age structure, deathrate, generation
time, etc are all straightforward.
Survivorship Curves
Survivorship curves measures the amount of living individuals of a population at each age. Figure 52.4 in the book (page 1087) illustrates this superbly well.
Type I, II, and III survivor ship curves.
The different types of curves are representing maximum life span versus number of survivors. Just look at the survivorship curve on page 1087, and it'll explain it to you perfectly!
Life Histories
Life History is just what its name implies - the traits that affect the events of an organism's life. Specifically, the events pertaining to schedule of reproduction and death. Like any other trait, traits of life histores arise out of evolution. Life history traits help biologists examine the growth of populations.
Patterns among Life Histories
Life histories vary from animal to animal, obviously, because each animal does their own thing differently. However, there are patterns in Life Histories. Briefly, they are:
Life histories are influenced heavily by environmental events/factors
Life history traits often linked
The first one is obvious, but the second one may need a little explaining.
Relationship between life history traits A nexample of linkage between life history traits are fecundality (same as birthrate) and mortality. Especially in birds, there is a noticeable relationship between the number of offspring generated and the life span of animals. For animals that produce lots of offspring, their lifespans are considerably shorter than those animals who only generate one or two children during their whole life time. This is an inverse relationship of life traits. |
The above example leads me to briefly review the two key terms, semelparity and iteroparity:
Semelparity is having one child, and
Iteroparity is having multiple children throughout a lifetime.
Population Growth Models
Now we start talking about the statistics of population growth.
ZPG is zero population growth - with no change in population over time - that means the number of births balance out the number of deaths.
Intrinsic Rate of Increase - maximum rate of population growth - the fastest rate a population can grow.
Exponential Population Growth - time to brush up on some rusty algebra. Instead of populations growing at the same rate every year, the rate itself changes. If you're in calculus, just think acceleration (dr/dt).
Carrying capacity - this isn't necessarily mean maximum population, but more like, the biggest stable population an environment have - that is, a population where there is very little change in population.
Logistic Population Growth - this type of growth model shows how the population growth tapers off as it reaches carrying capacity. Here's a diagram I photoshop'd to show you what a logistic population looks like:
Logistic Population Growth Graph
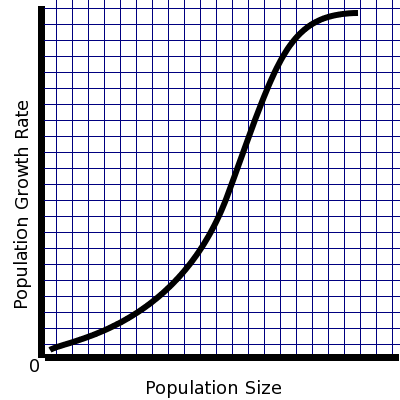
Ok, so maybe the graph sucks, but it's the most I can do in the time I have. But it clearly shows how the population growth starts to go down and then level off (well it doesn't show in the graph) as it reaches carrying capacity. But that's what logistic population growth. If you ever encounter it on the test, just think of the ugly graph Henry drew.
Life History Strategies and Population Growth
Natural selection plays a huge role in population growth. In a population reaching carrying capacity, there's more individuals to divide out the food among, right? So that means each individual gets less food. Natural selection then starts to favor individuals that can reproduce with less resources.
So what about small populations? They have enough food to distribute, what does natural selection favor? Now it starts to favor individuals that have earlier maturity and increase fecundality, to promote bigger population growth rates.
These are all called 'Life history strategies.' For high-density populations where natural selection favors a high fecundality resource ratio, it is called a K-selected trait, and for the inverse (low density populations where natural selection favors rapid population growth), it is called an r-selected population.
K-selected - K for karrying capacity.
r-selected - r for growth rate. (That makes tons of sense)
(Note, r-selected populations are also called opportunistic populations).
(Oops, K-selected are also called equilibrial populations).
Population Limiting Factors
Intraspecific Competition
A density dependent factor is one that restricts population growth
increasingly as population gets larger. Think of the logistic population
growth model graph again.
Density-independent factors
These factors that restrict population growth aren't limited by the density of the population - they affect the population no matter what - things such as thunderstorms, floods, etc.
KEY: A mix of density-dependent and density independent factors probably limits the growth of most populations.
There aren't that many Big Concepts (tm) to population ecology, and I suspect that'll be the same for community ecology, but we'll see. The key thing here are all the different types of growth models and how natural selection plays a role in it.